This blog is Part 1 of the "Own Your NetSuite" series, which focuses on features, functions and tricks every NetSuite user should know to get the most out of the platform.
In my 10-plus years as a NetSuite consultant, I've come to realize a very important fact: NetSuite is huge! With so many features, and new ones coming out twice a year, it's almost impossible for a standard user to keep up with it.
That's where I come in! It's literally my job to stay up to date on all things NetSuite related. So why not share this wealth of information with you?
A Quick Overview of Analytics Workbooks
Let’s talk about Analytics Workbooks. This is the next evolution of reporting tools, complementing Reports and Searches. The Analytics Workbooks feature has been around for a few years, yet few of our clients leverage its amazing power.
Maybe that's because the tool had a bit of a rocky start, with issues like missing fields, but trust me, it's gotten much better over the years. And once you know how to leverage this tool, you’ll be able to build amazing workbooks that combine tables, pivot reports and graphs to analyze all facets of a business unit in a single place.
Analytics Workbooks have two main components: Datasets and Workbooks. Think of the Dataset like a table of information and the Workbook as how you’ll visualize that information, or data. We'll look at each of these more in detail below in this quick overview.
I’m going to run through a simple example of a Workbook and have you follow along. So, please log into your NetSuite account and get ready to dip your toes into Analytics Workbooks.
Getting Access to Analytics Workbooks
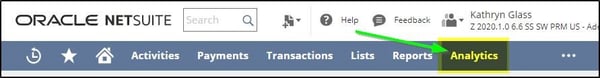
To get started, click on the Analytics navigation menu at the top of the screen, as shown here:
Is the Analytics tab visible to you? If not, your NetSuite Admin may have to update your role. There are two ways the Admin may do this:
- To provide Workbook access to users, grant SuiteAnalytics Workbook permission and set the access level to Edit on the Reports subtab of the Permissions tab.
- To edit and monitor Workbooks other users have created in your account, add the Analytics Administrator permission to your role on the Setup subtab of the Permissions tab.
Workbook Overview
Before we start building our own Dataset and Workbook (I’ll cover that in Part 2), let’s go over the basics of the Workbook page.
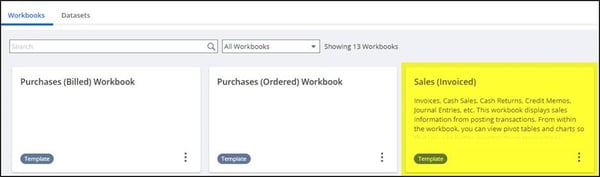
NetSuite has several templates you can use by clicking on the Analytics subtab. Hopefully, you have access by now! To see the elements of the Workbook page, let's review the Sales (Invoiced) Workbook highlighted below by clicking Template:
Here's the Workbook page in all its glory:
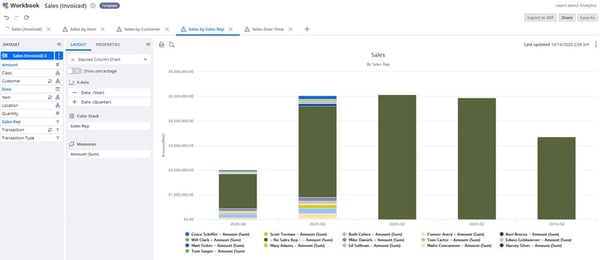
This page contains many important elements. Let's walk through each.
Tabs: The tabs at the top of the Workbook allow you to view different visualizations (e.g., tables, pivot reports and graphs). You can also add new visualizations with the plus (+) sign to the right of the tabs, as seen in the example below.

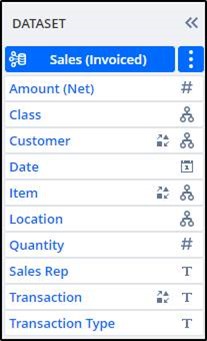
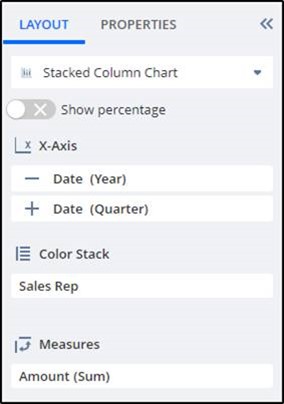
Dataset section: The Dataset section allows you to drag and drop the fields you want to use from the associated Dataset in the current visualization. It will look similar to the following:
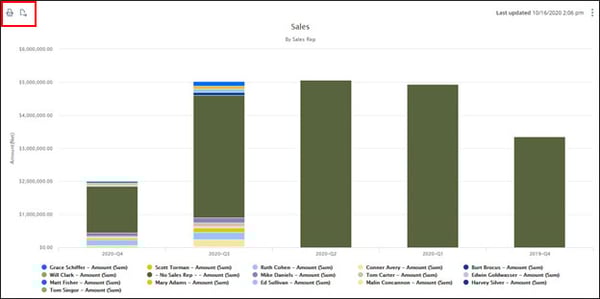
Visualization Pane: The Visualization Pane is where the data is displayed. Notice there are two small buttons in the top left: Print and Export, as outlined in red in the below example.
Action Buttons: Finally, the buttons on the top right of the page allow you to Export the Workbook to the SDF (SuiteDeveloper Framework), Share it with other users, and make a copy of it using Save As. The buttons look like this:

I hope this gave you the courage to try out Analytics Workbooks. In Part 2, I'll walk through how to create your own Dataset and Workbook from scratch. In the meantime, if you have any questions or comments, please do not hesitate to reach out!